

GTA Housing Market Update – September 2026
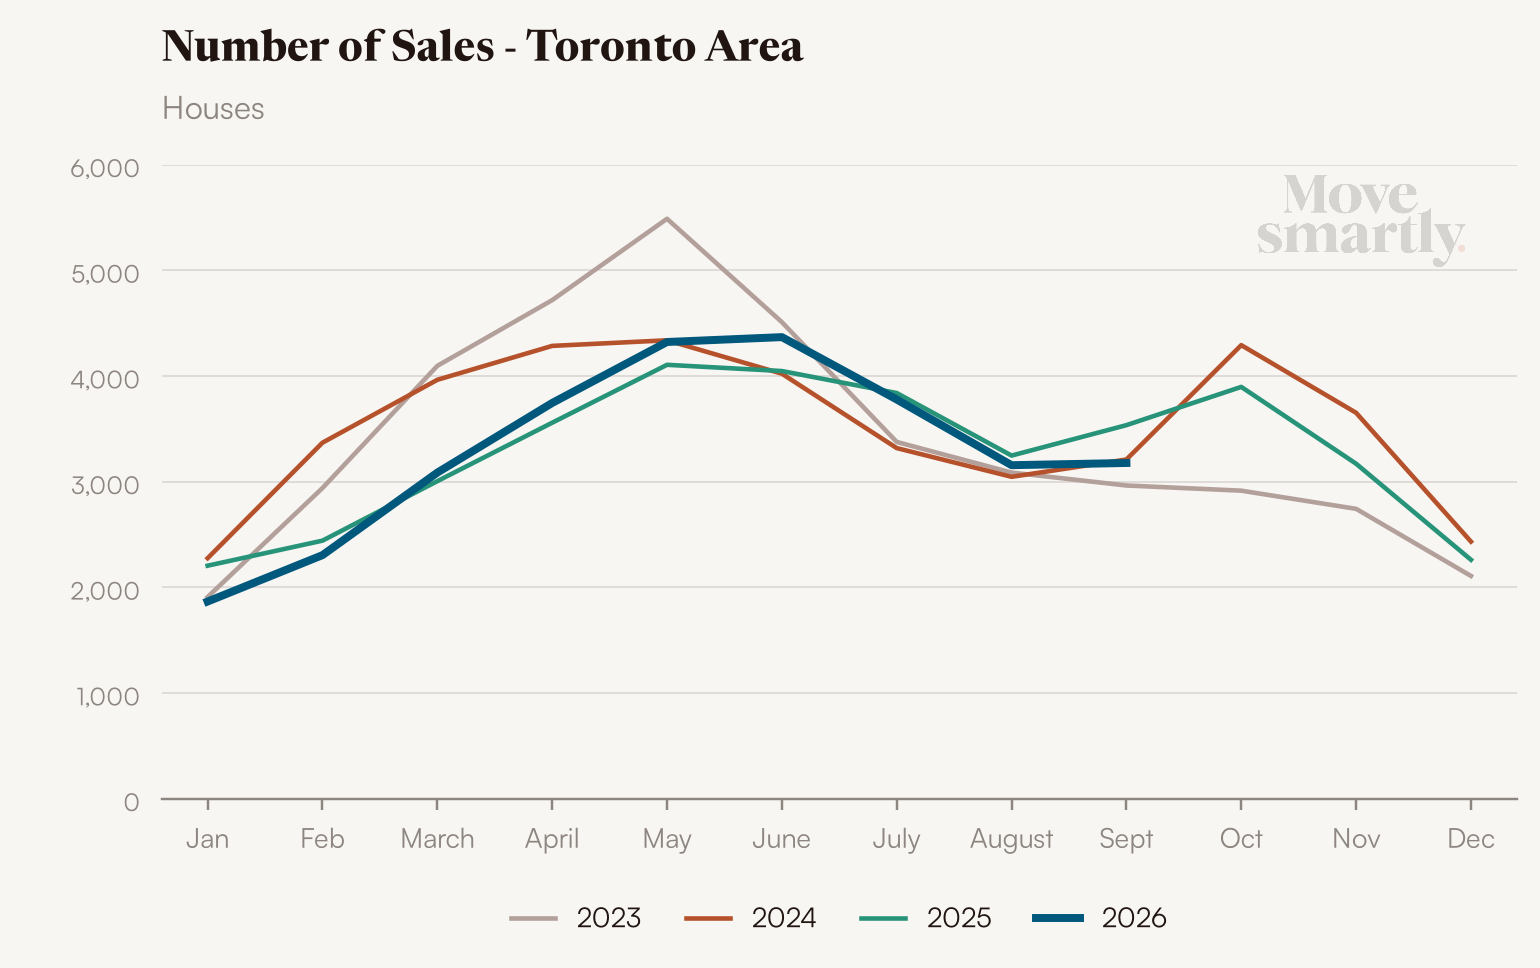
The spring brought a slight uptick in home sales. The second half of 2026 is moving in the opposite direction. House sales ran ahead of last year from March through June, up 3%, 5%, 5% and 8%. July gave back 2%, August 3% and September 10%.
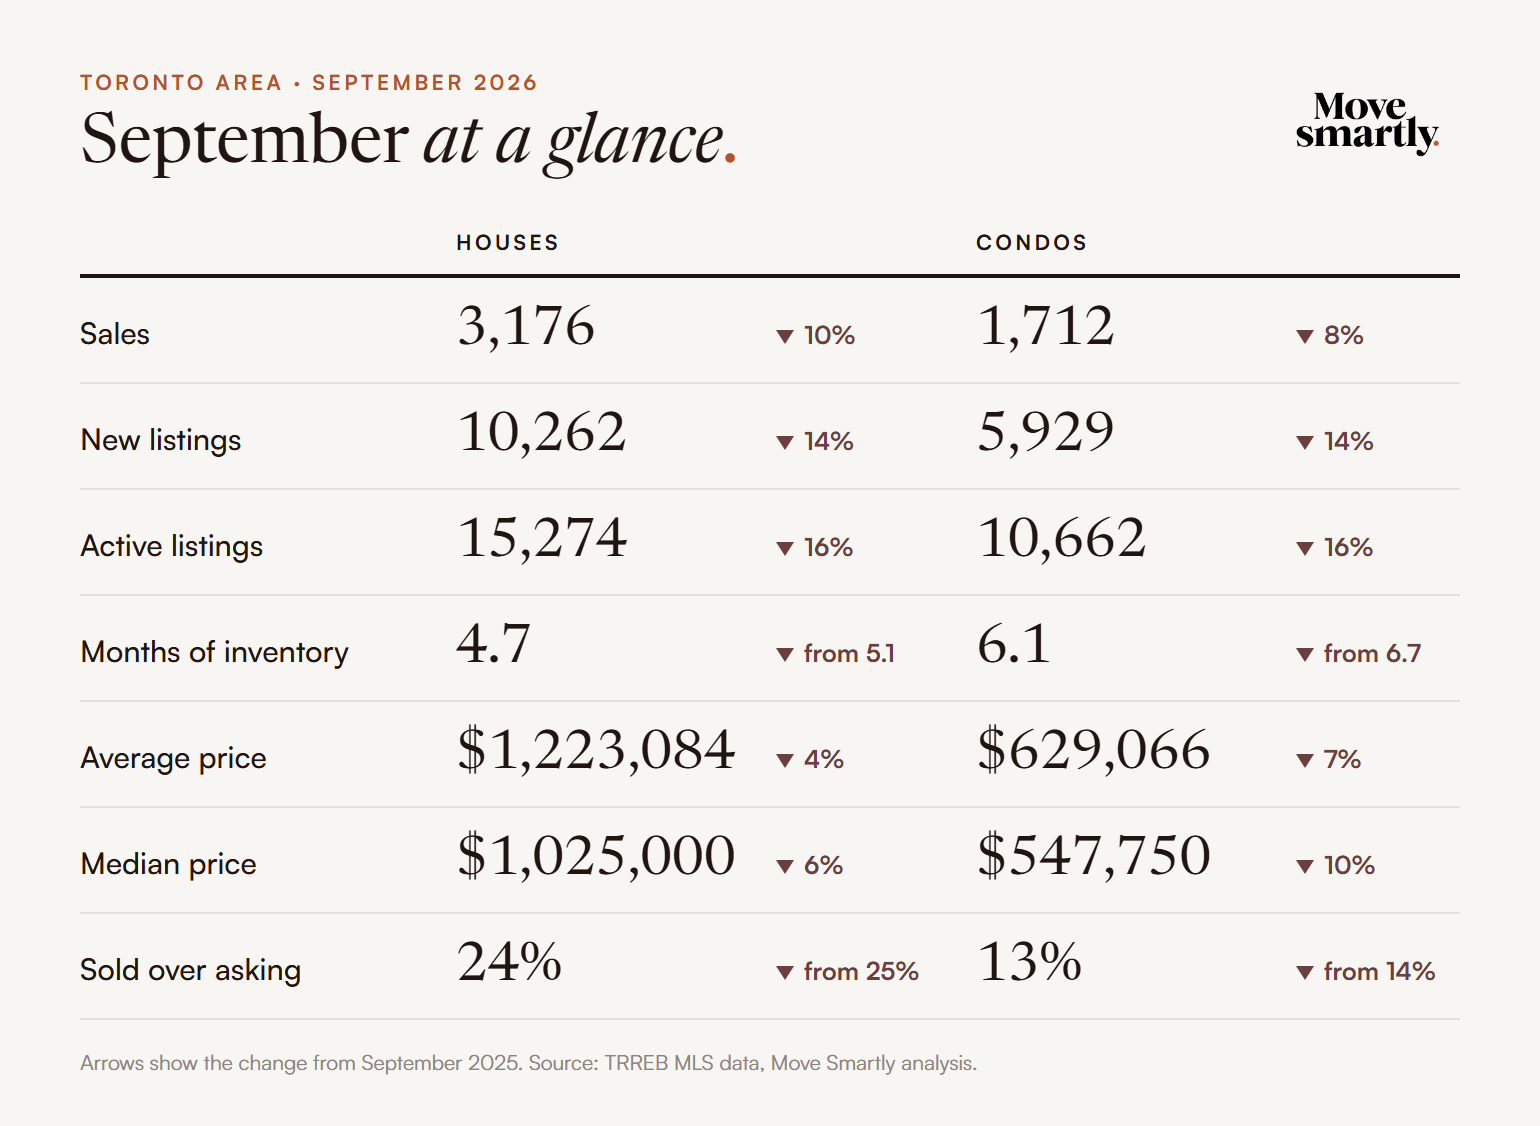
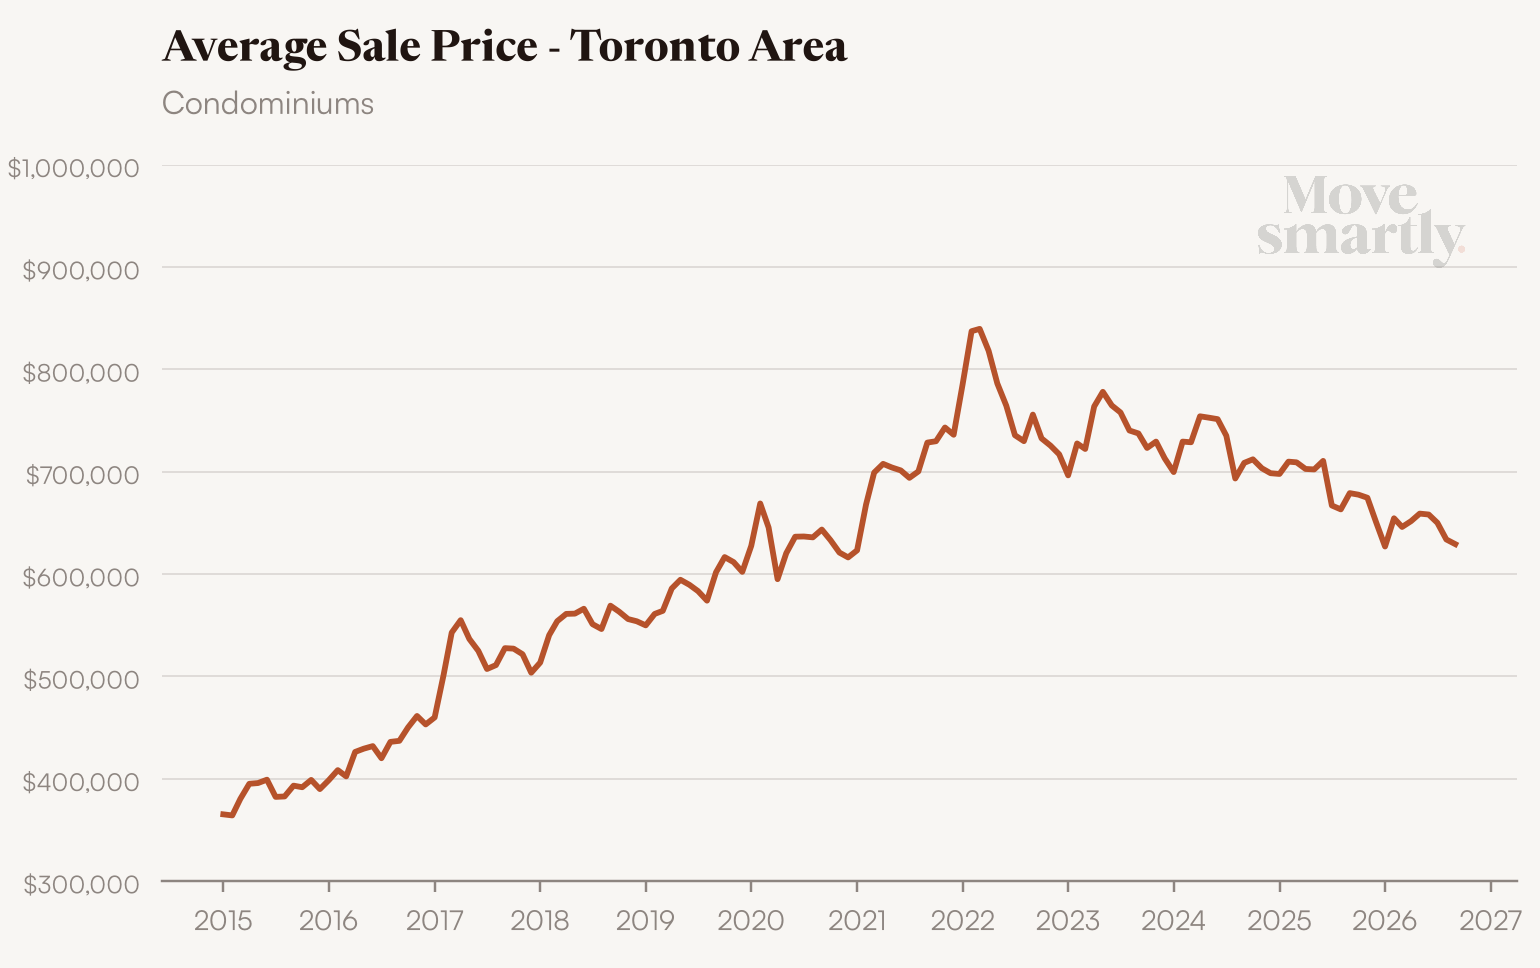
First, what we are seeing on the ground. House sales were down 10% from last September and condo sales were down 8%. The 1,712 condo sales were the lowest September total in our data, which goes back to 2003. The median house price was down 6%. The median condo price was down 10% to $547,750, the lowest since September 2019 and 29% below the peak in March 2022.
The fall market usually brings a wave of new buyers. House sales normally rise about 4% from August to September, and they rose 9% last year. This year they rose 1%. Relatively few buyers have jumped in, and that is adding to the slowdown.
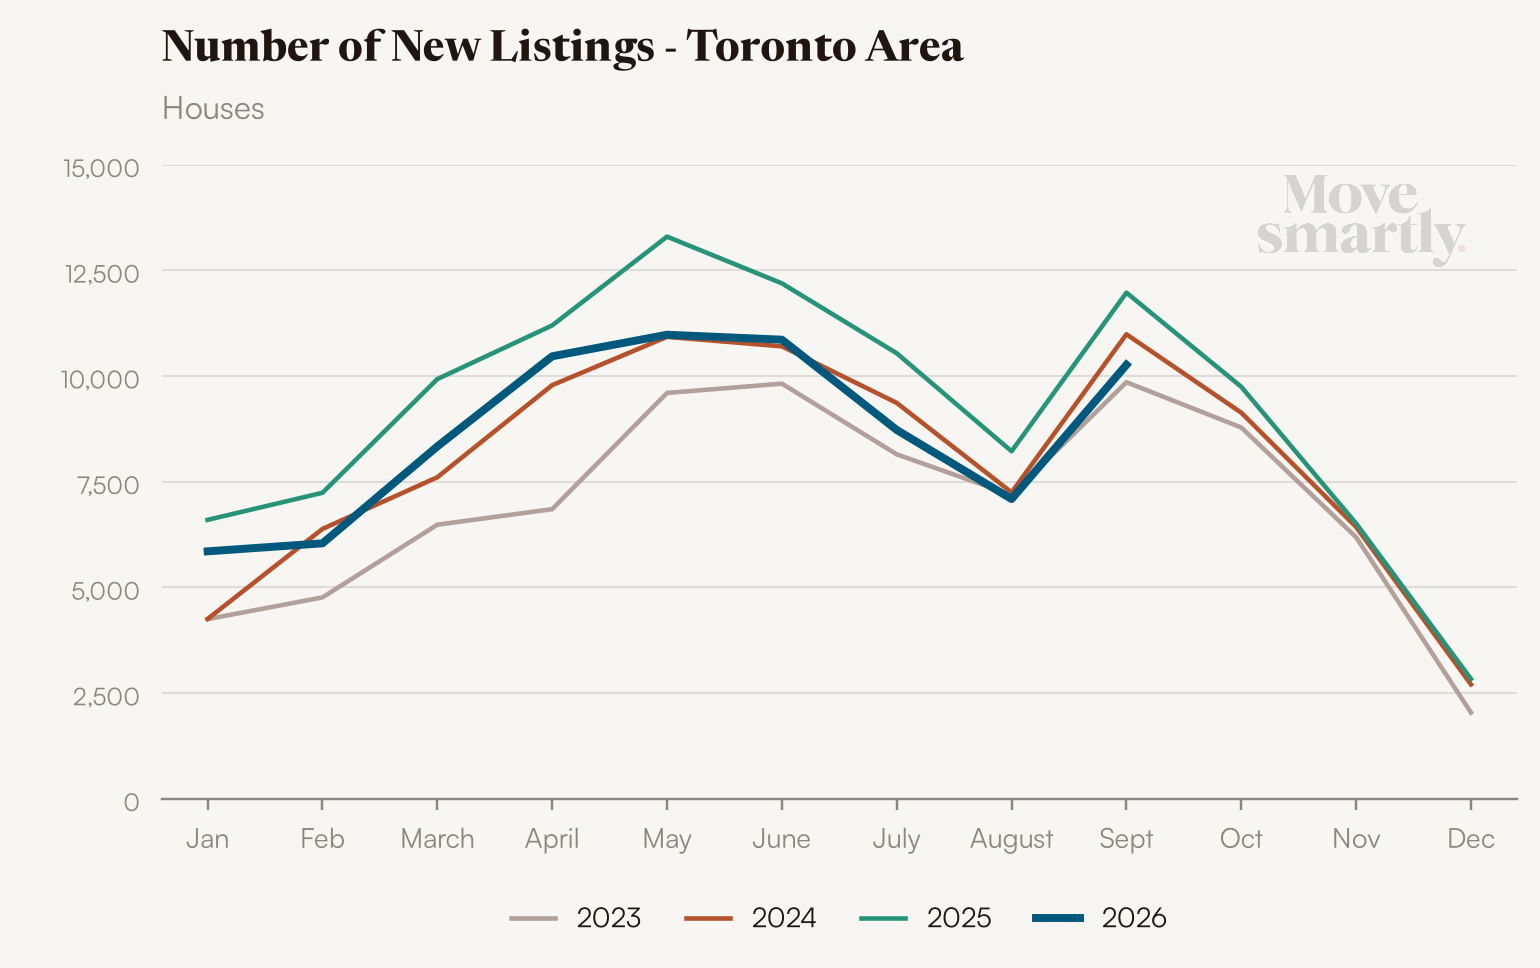
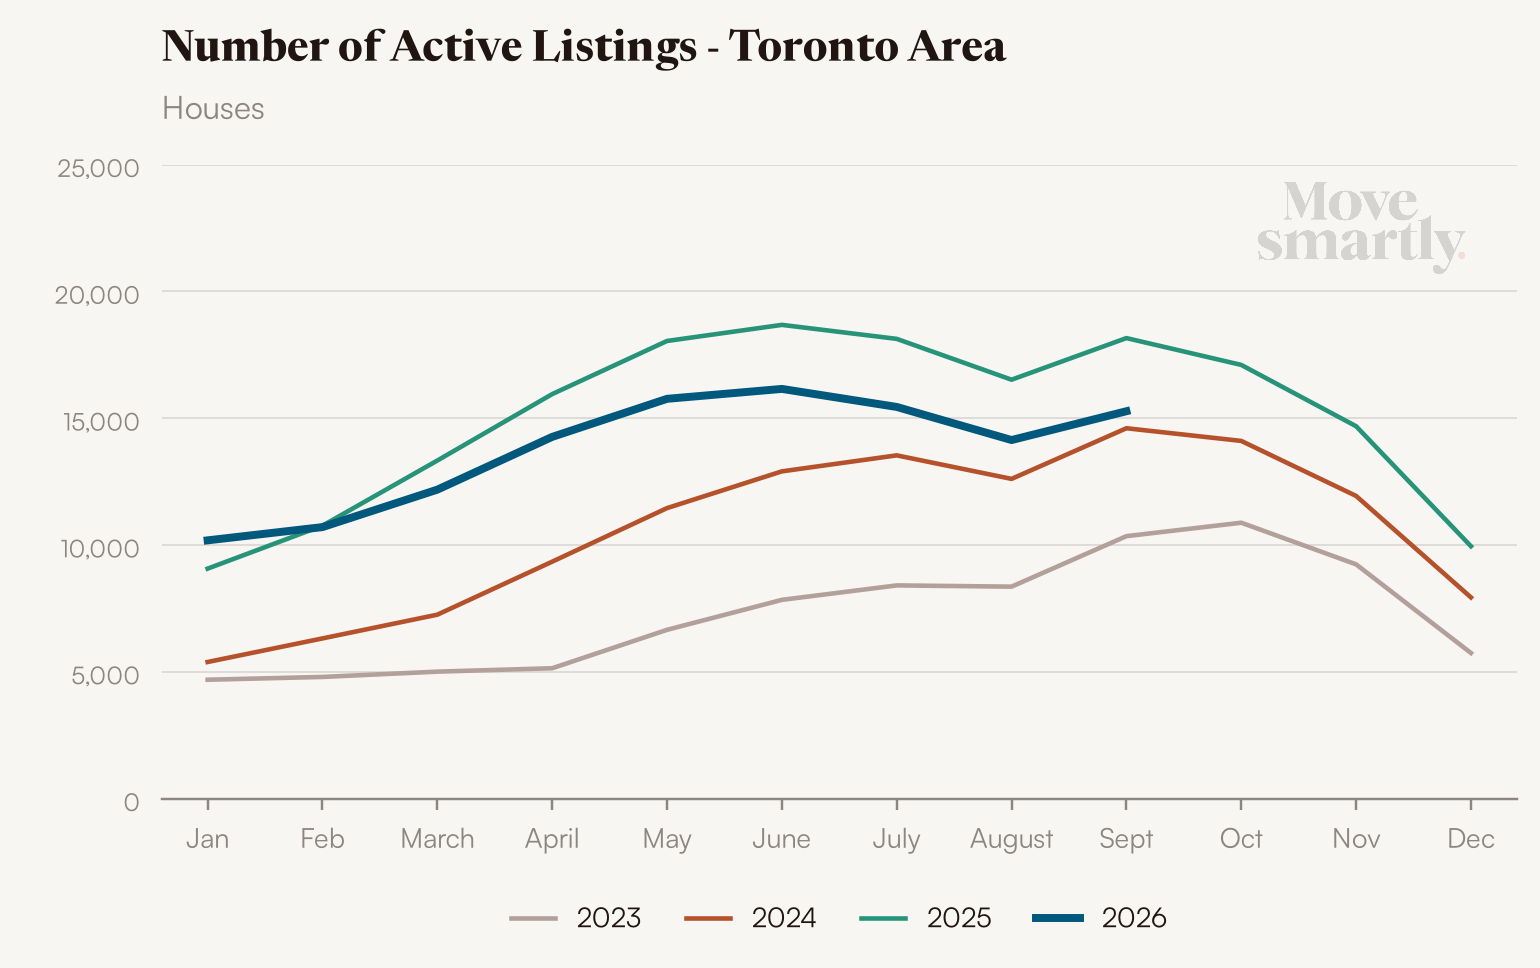
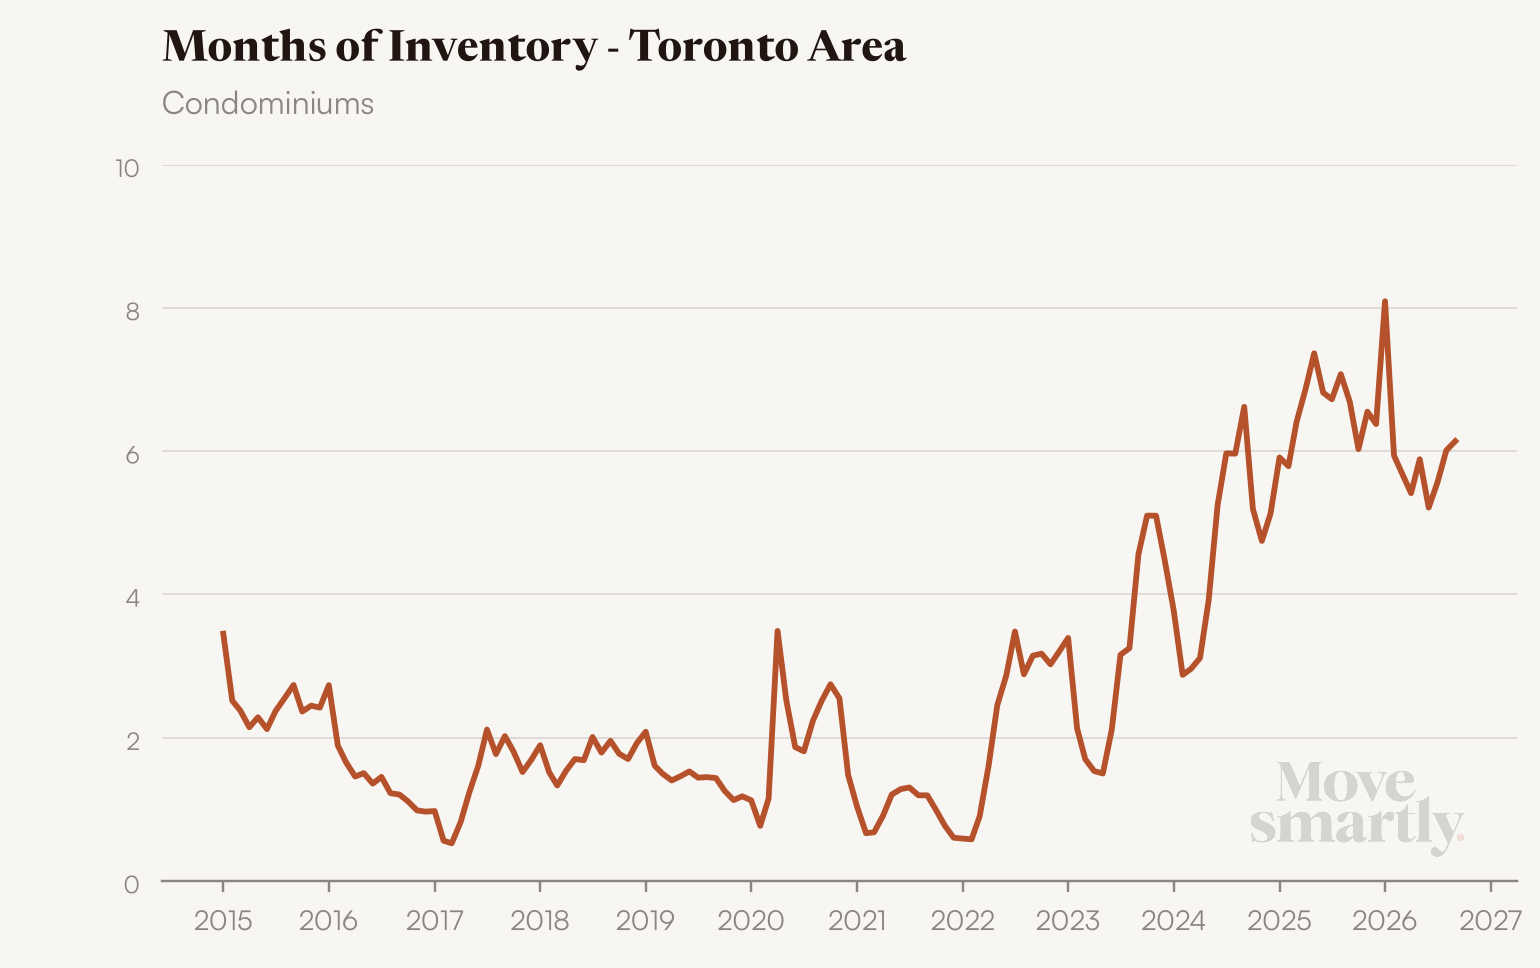
Sellers are stepping back alongside buyers. New listings were down 14% for both houses and condos, and active listings were down 16%. That is keeping inventory from piling up. Months of inventory is lower than a year ago, 4.7 against 5.1 for houses and 6.1 against 6.7 for condos, and it is why prices are drifting lower rather than falling sharply.
What is driving the slowdown? Two big factors.
The first is interest rates. Long-term bond yields have surged over the past month, and that is pushing up fixed mortgage rates. Fixed rates are now in the mid-4% range and are likely to keep rising in the weeks ahead. The Bank of Canada has also signalled that its policy rate will likely be going up, with bond markets pricing in five rate hikes by the end of next year.
The second is the economy. The outlook remains very uncertain, and Canada’s last-minute decision to walk away from a trade deal with the United States has heightened consumer fears and hurt consumer confidence.
Higher interest rates and falling consumer confidence are the key ingredients of a weaker housing market, not the more competitive one many had hoped for.
Expect the housing market to remain sluggish through the second half of 2026.
Monthly Statistics
House Statistics
House sales (low-rise freehold detached, semi-detached, townhouse, etc.) in the Greater Toronto Area (GTA) in September 2026 were down 10% compared to the same month last year.
New house listings in September were down 14% compared to last year.
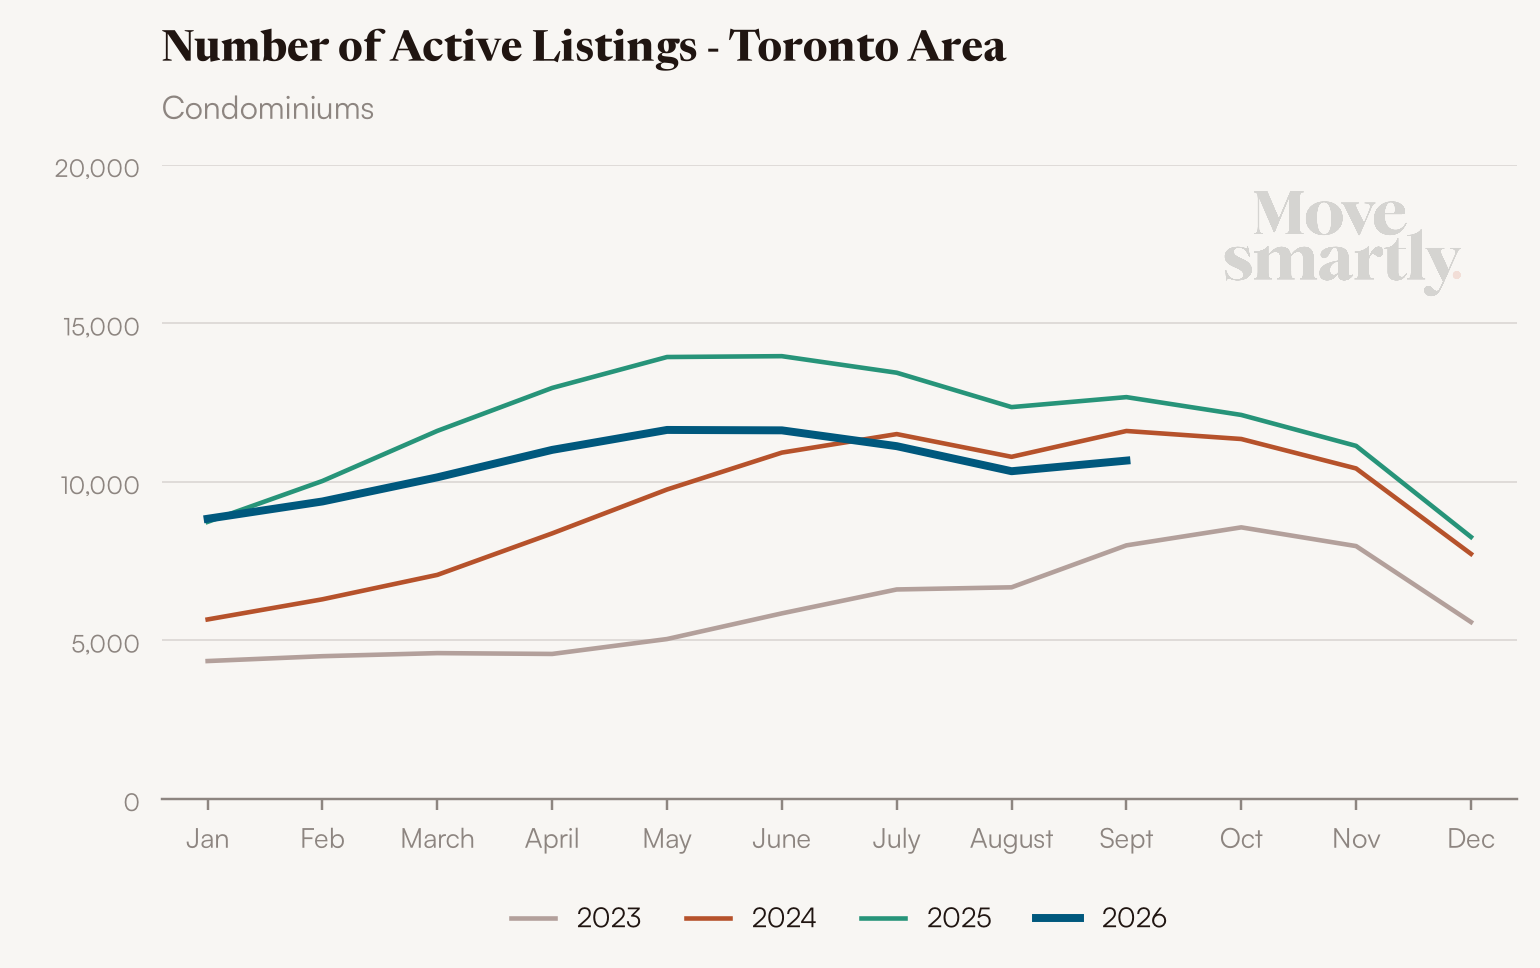
The number of houses available for sale (“active listings”) was down 16% in September compared to the same month last year.
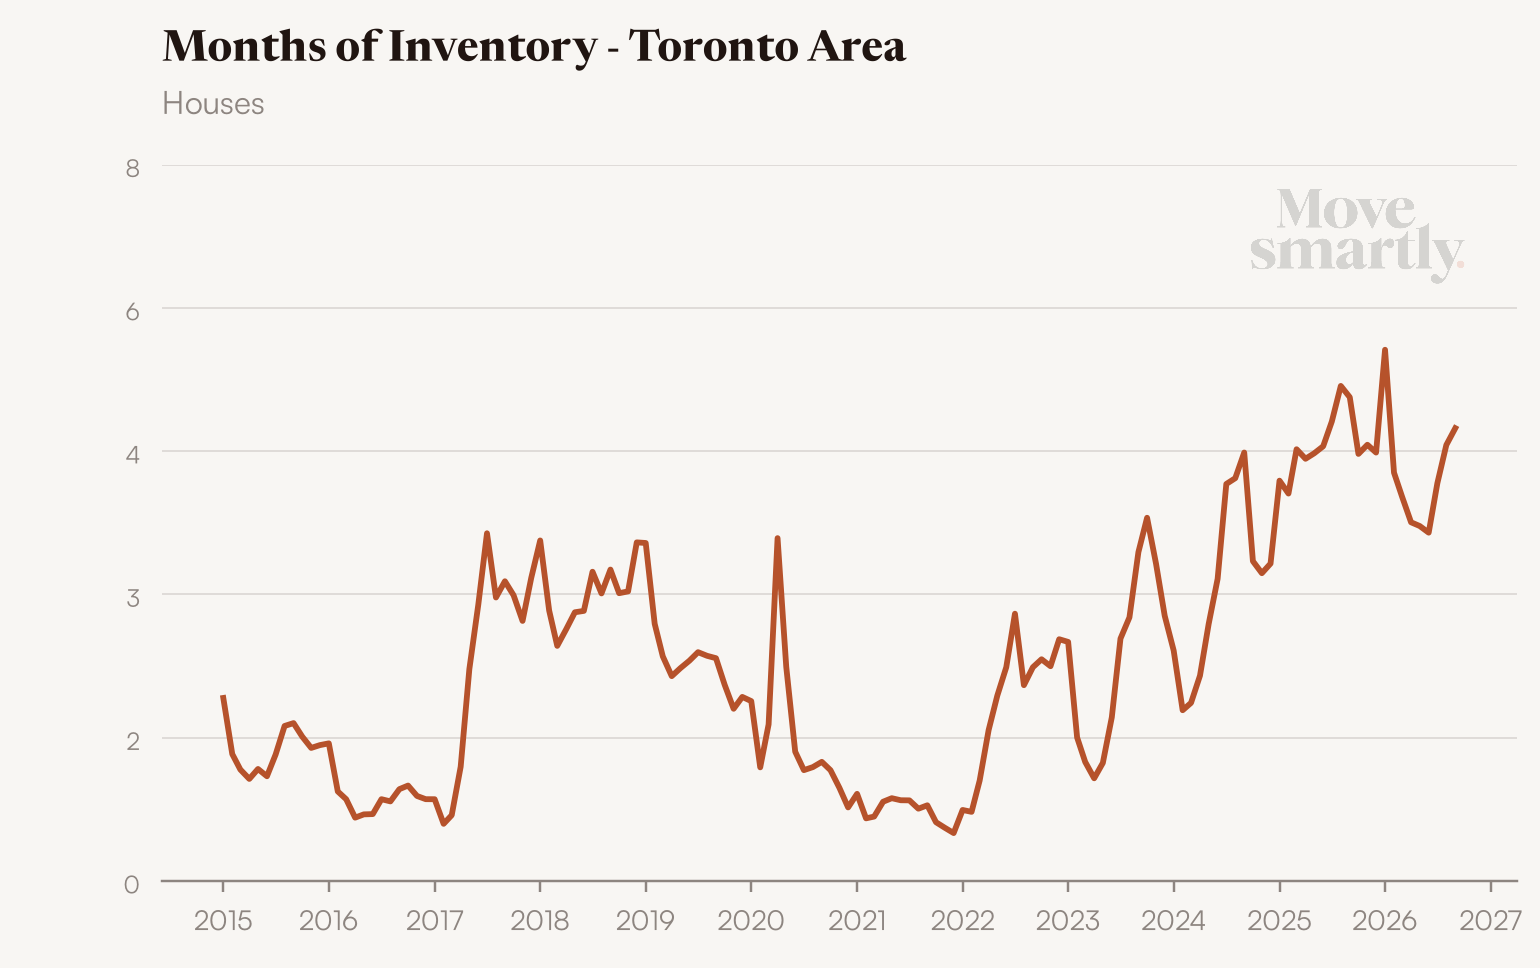
The Months of Inventory ratio (MOI) looks at the number of homes available for sale in a given month divided by the number of homes sold in that month. It answers the following question: If no more homes came on the market for sale, how long would it take for all the existing homes on the market to sell, given the current level of demand? The higher the MOI, the cooler the market is. A balanced market (a market where prices are neither rising nor falling) is one where MOI is between four to six months. The lower the MOI, the more rapidly we would expect prices to rise.
While the current level of MOI gives us clues into how competitive the market is on-the-ground today, the direction it is moving in also gives us some clues into where the market is heading.
The MOI for houses increased to 4.7 in September.
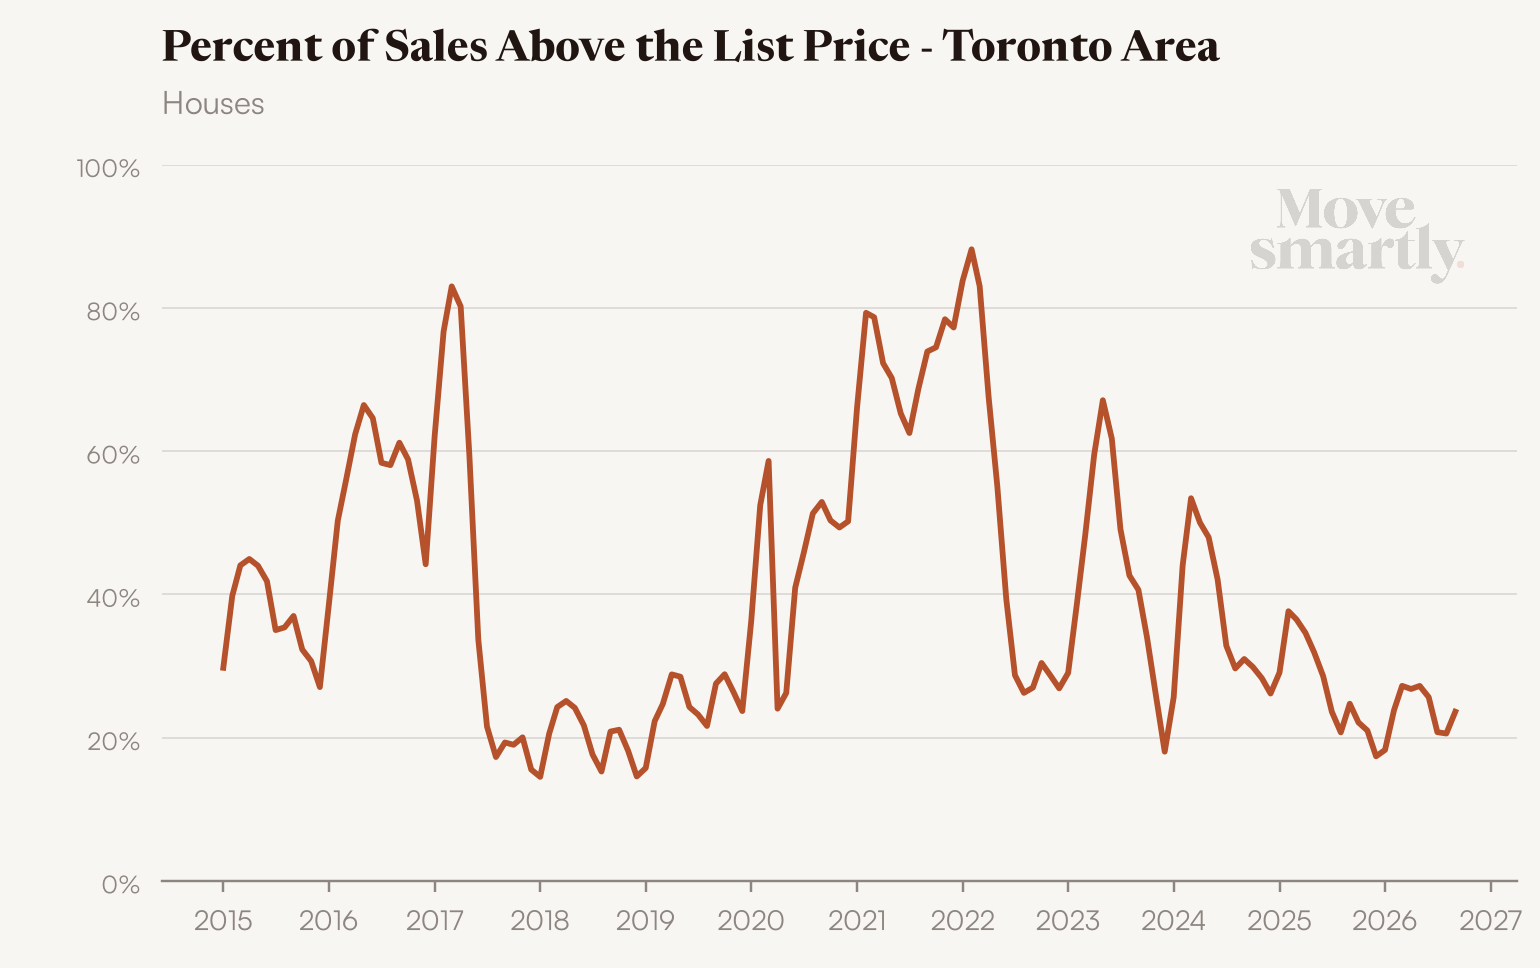
The share of houses selling for more than the owner’s list price was 24% in September, up from 21% in August.
The average price for a house in September 2026, $1,223,084, was down 4% from the same month last year.
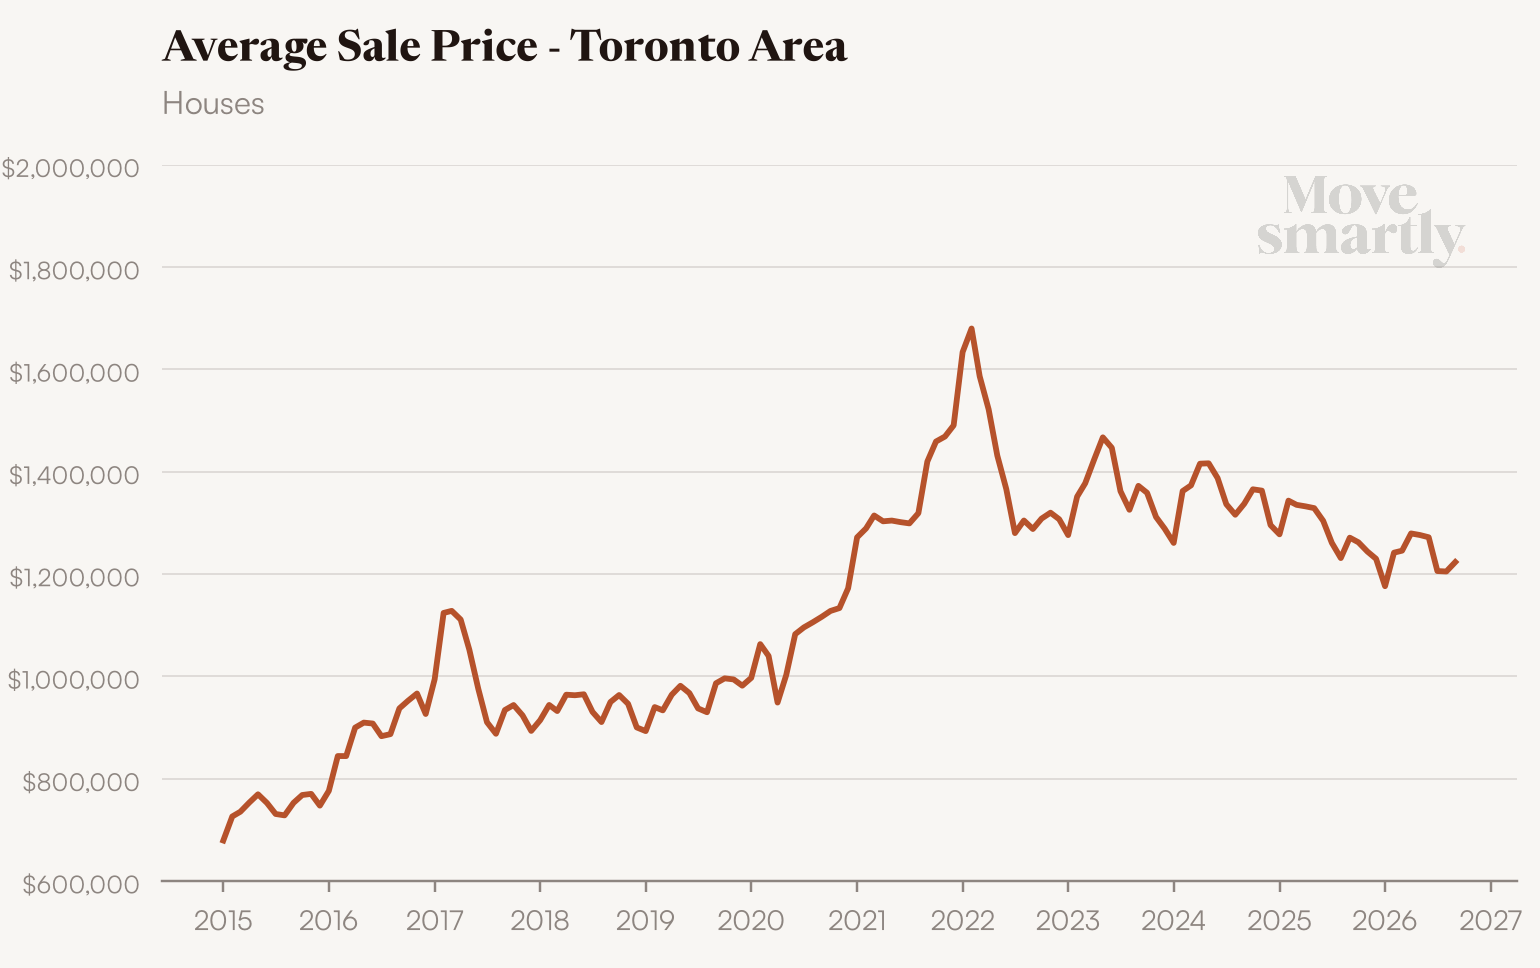
The median house price in September was $1,025,000, down 6% over last year.
The median is calculated by ordering all the sale prices in a given month and then selecting the price at the midpoint of that list such that half of all home sales are above that price and half are below that price. Economists often prefer the median price over the average because it is less sensitive to big increases in the sale of high-end or low-end homes in a given month, which can skew the average price.
Condo Statistics
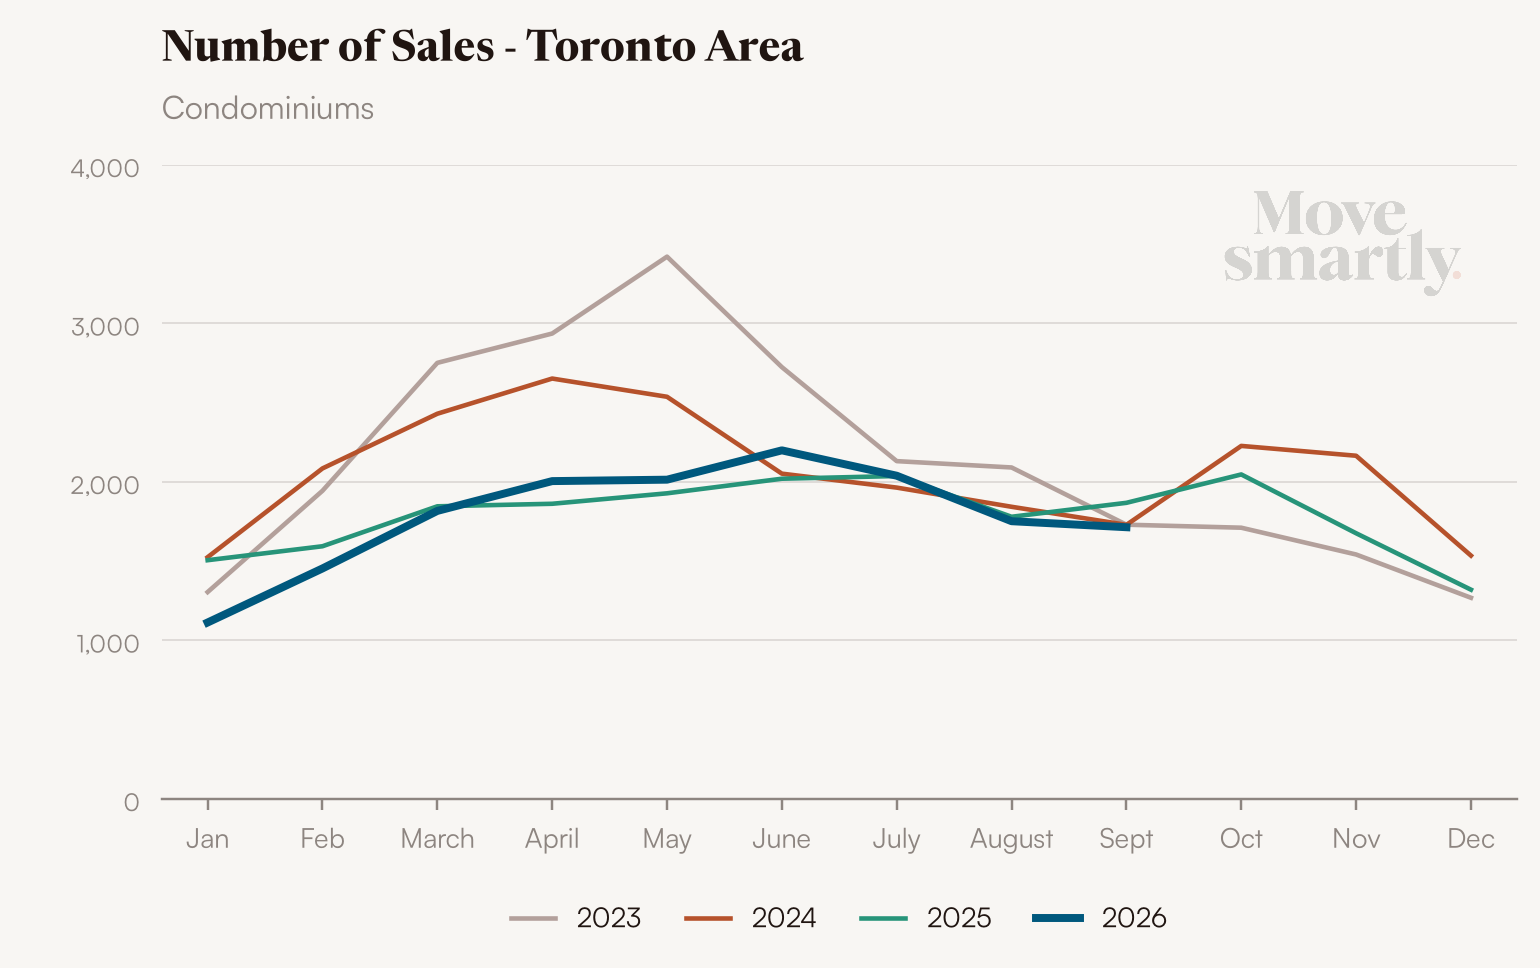
Condo (condominiums, including condo apartments, condo townhouses, etc.) sales in the Toronto area in September 2026 were down 8% compared to the same month last year.
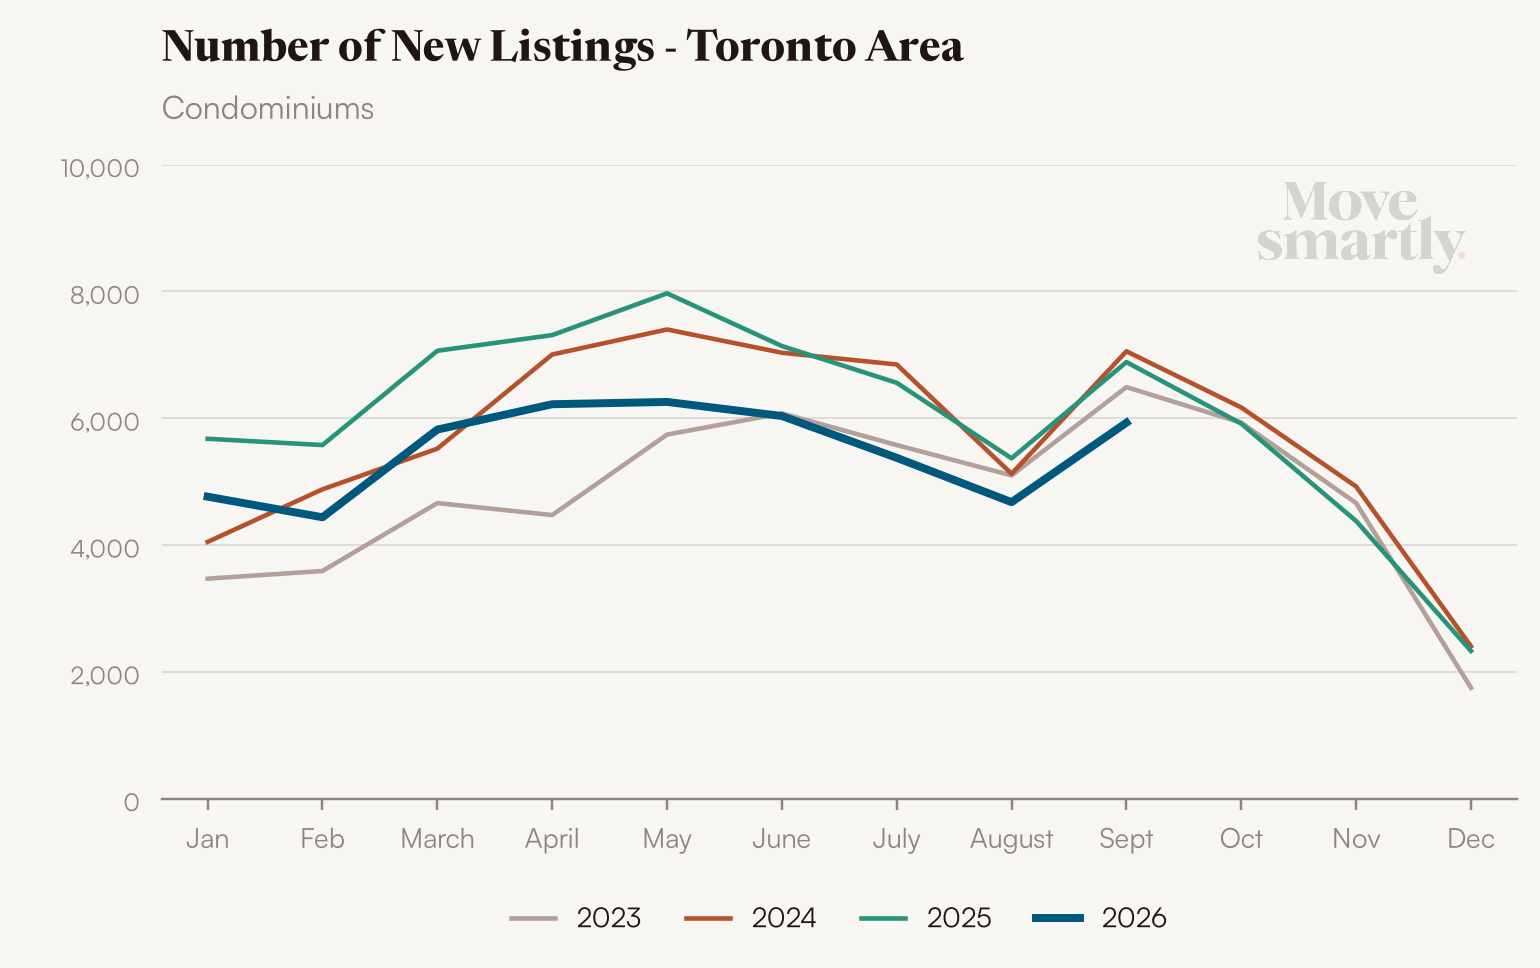
New condo listings were down 14% in September over last year.
The number of condos available for sale at the end of the month, or active listings, was down 16% over last year.
Condo months of inventory increased to 6.1 MOI in September.
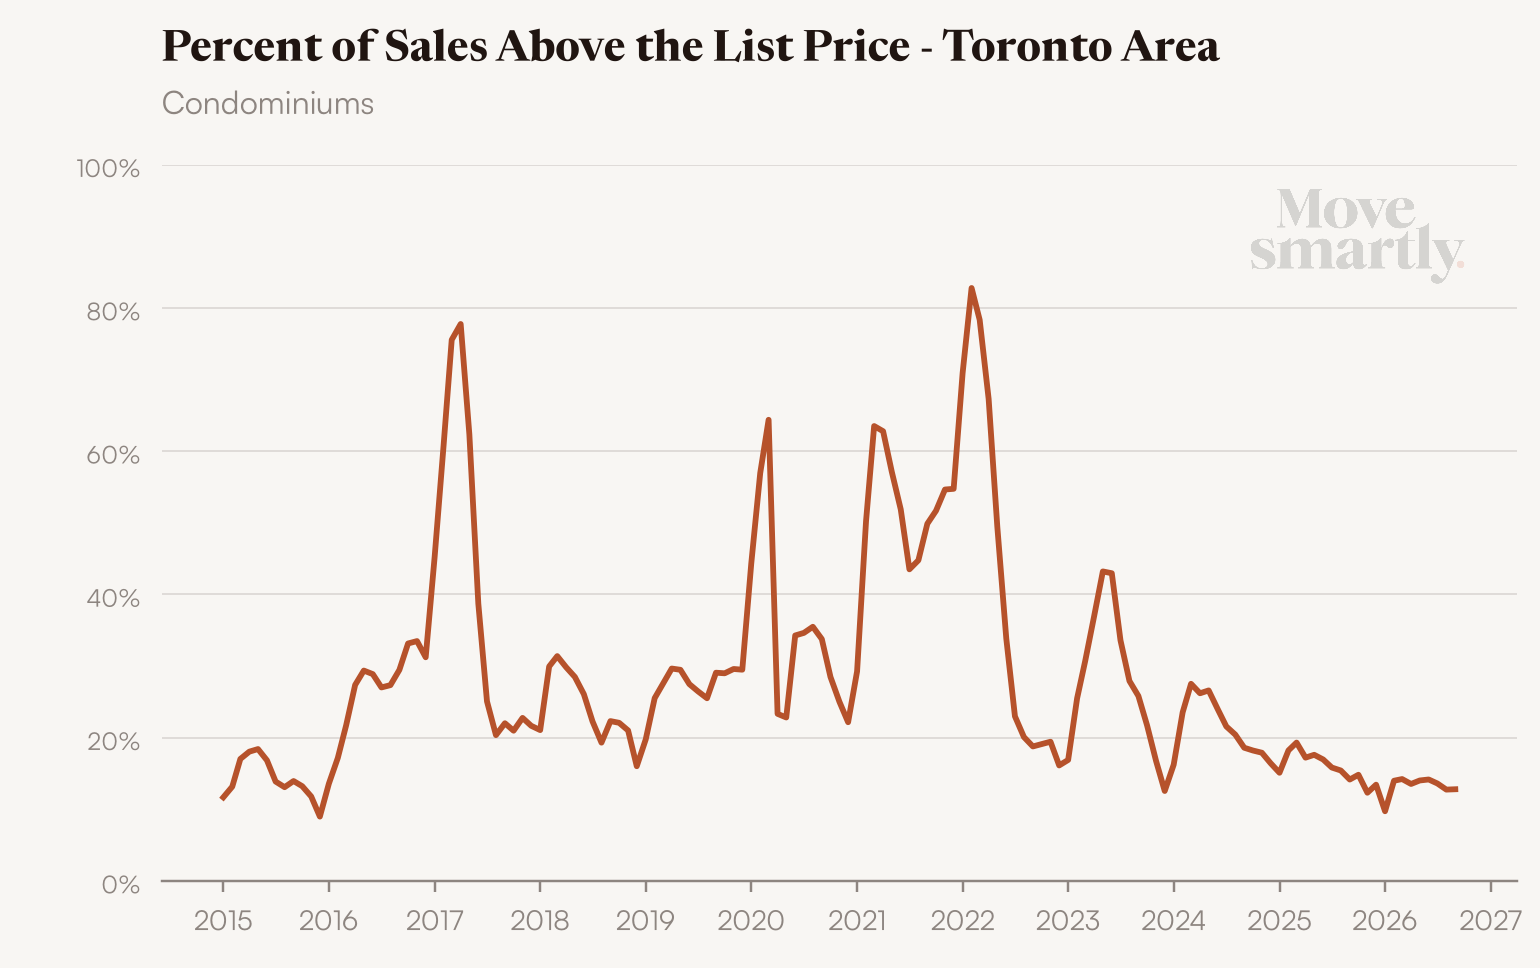
The share of condos selling for over the asking price was 13% in September, unchanged from August.
The average price of a condo in September was $629,066, down 7% from last year. The median price was $547,750, down 10% from last year.
Regional Trends
Houses
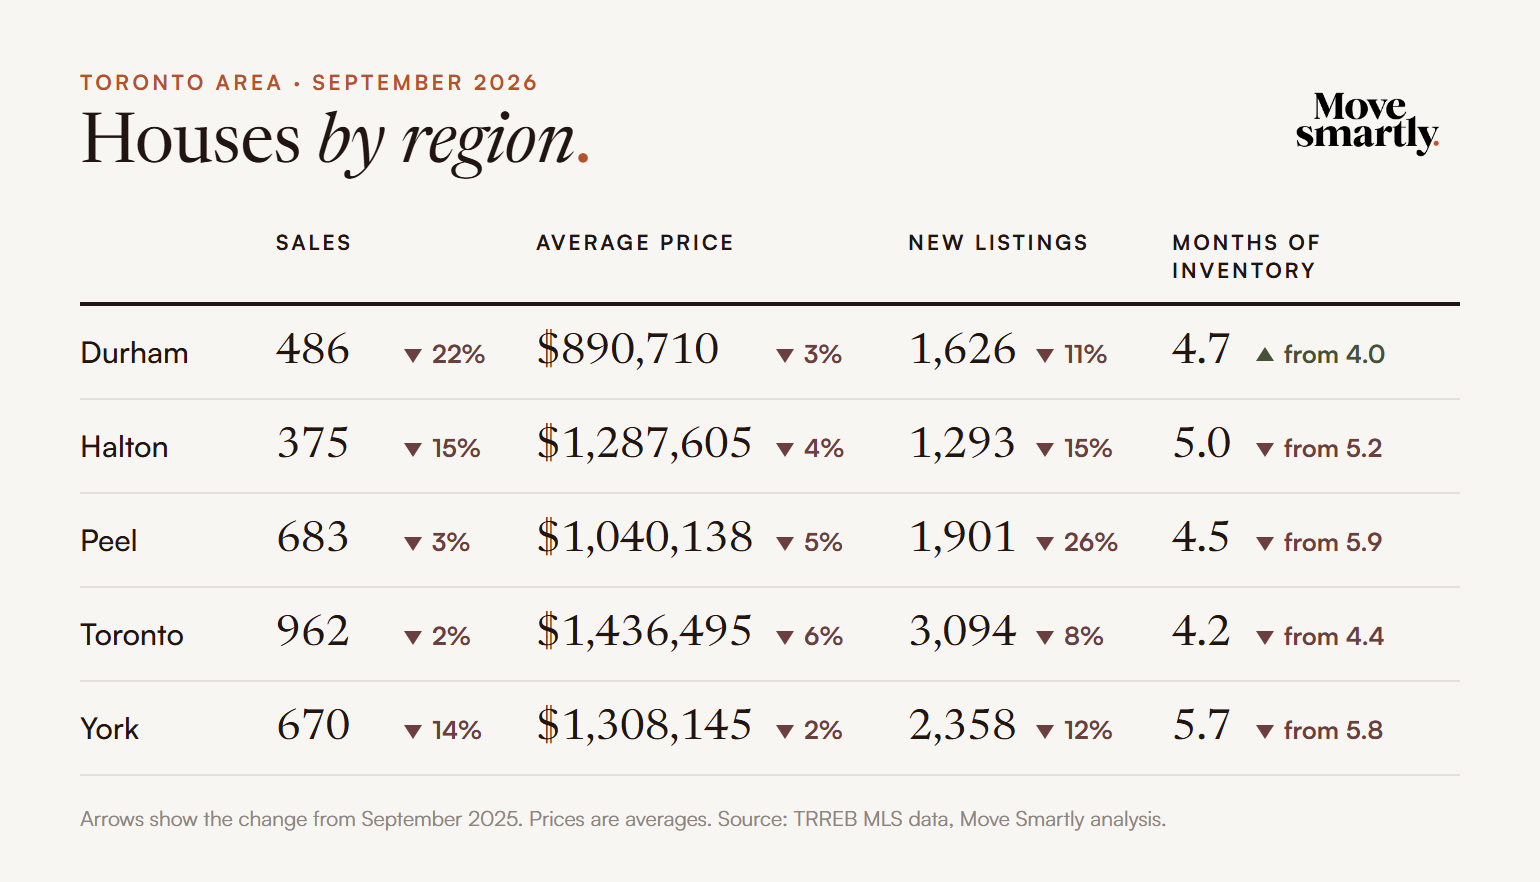
House sales were down from last year in all five regions. The declines were largest in Durham, down 22%, and smallest in Toronto and Peel, down 2% and 3%. Average prices fell in every region, by between 2% and 6%. New listings were down everywhere too, led by a 26% drop in Peel. Months of inventory is lower than last year in every region except Durham, where it rose from 4.0 to 4.7.
Condos
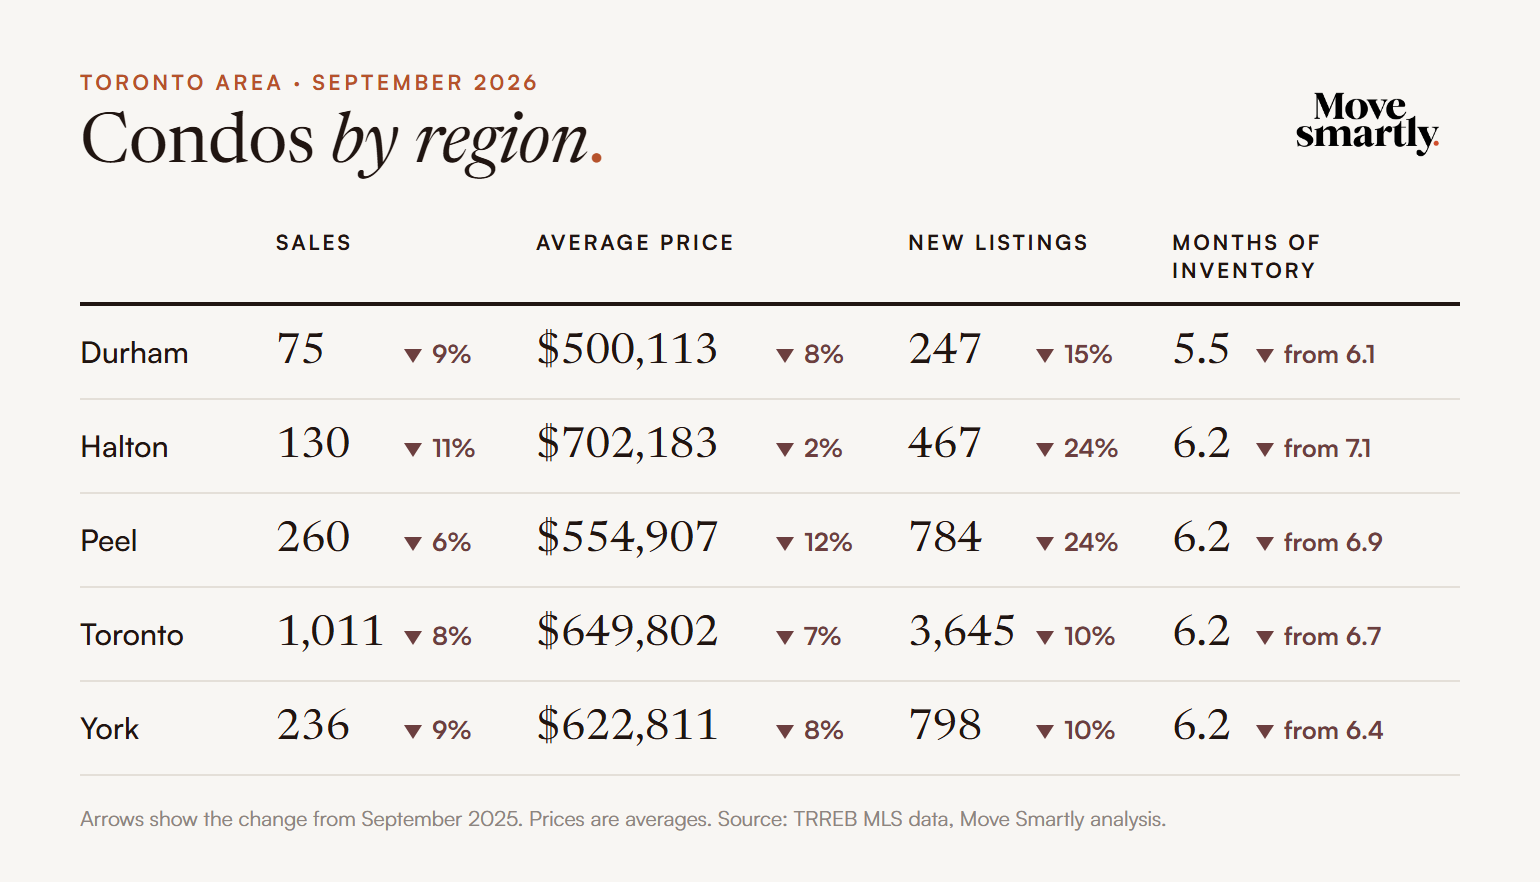
Condo sales were down in all five regions, by between 6% and 11%. Average prices fell everywhere, the most in Peel, down 12%, and the least in Halton, down 2%. New listings were down in every region, and by about a quarter in Halton and Peel. Months of inventory is lower than last year across the board, but it is still above six months everywhere except Durham.
Published: October 02, 2026